Here is the failure nobody plans for: your monitoring runs on the same box as the thing it monitors. The disk fills, the hypervisor dies, the network drops — and the alert that should have woken you up dies with it. You find out when a customer emails.
Uptime monitoring in 2026 is no longer about which dashboard has prettier green pills. It is an architecture question: where does the checker live, and where does the evidence live? Tianji, UptimeFlare and Checkup answer that question in three completely different ways — a self-hosted all-in-one, a serverless edge deployment, and a distributed lock-free agent. I deployed all three and broke them on purpose.
TL;DR — Quick Verdict
- Tianji if you want website analytics, uptime checks and server status in one self-hosted panel with a Postgres database you control. Best single-pane experience; weakest blast-radius isolation.
- UptimeFlare if you want checks running from 300+ cities for free and a public status page with no server to maintain. Best isolation per dollar; you are renting Cloudflare’s edge, not owning it.
- Checkup if you need health checks that survive your own datacenter dying — distributed agents writing to shared storage, a static status page, and no database to babysit. Best for “prove it from outside” requirements; barest UI.
The decision rule: if your monitoring shares a power supply with your production, you do not have monitoring. You have a second dashboard.
Comparison table
| Dimension | Tianji | UptimeFlare | Checkup |
|---|---|---|---|
| License | Apache-2.0 | Apache-2.0 | MIT |
| GitHub stars | 3,119 | 3,937 | 3,463 |
| Last commit | 2026-11-12 | 2026-10-21 | 2026-11-11 |
| Language | TypeScript | TypeScript | Go |
| Where checks run | Your server | Cloudflare Workers (310+ cities) | Any number of agents |
| Storage | Postgres | Cloudflare D1 | S3, Postgres, MySQL, SQLite3, local file, GitHub |
| Status page | Built-in | Built-in, themed, CNAME-able | Built-in, minimal |
| Extra features | Web analytics, server status, alerts | Geo-specific checks, maintenance windows, JSON API | HTTP/TCP/DNS/TLS checkers, pluggable notifiers |
| Check interval floor | ~1 minute | 1 minute (50 checks) | Whatever your cron says |
| Hosting cost | VPS + Postgres | Free tier usually sufficient | VPS or free static hosting |
| Setup time | 20–30 minutes | 10 minutes | 45–60 minutes |
Decision matrix
| Your situation | Use this | Why |
|---|---|---|
| “One dashboard for traffic, uptime and server load” | Tianji | Analytics and uptime share one data model and one login |
| “I don’t want to run a server just for status checks” | UptimeFlare | Deploys to Workers, no VM, no database to patch |
| “I need checks from multiple regions to catch local outages” | UptimeFlare or Checkup | Geo checks (UptimeFlare) or multi-agent polling (Checkup) |
| “My status page must stay up when my cluster is down” | Checkup | Static page from object storage; no app server in the path |
| “I need uptime evidence for an SLA report” | Checkup + Grafana | Long-lived JSON/SQL history you can query years later |
| “Smallest possible moving-parts count” | UptimeFlare | No containers, no Postgres, no cron host |
Tianji — the all-in-one panel
Tianji (3,119 stars, Apache-2.0, TypeScript) is the “one login for everything” option: web analytics, uptime monitors, and server status agents in a single Next.js application. If you already self-host a dozen services and want one more container instead of three, this is the pragmatic pick.
Upstream docker-compose.yml (fetched from the repository, abbreviated only where noted):
| |
Two hard rules for a production deployment. Set ALLOW_REGISTER: "false" before first boot — an open registration endpoint on a public status host is an invitation. And set JWT_SECRET to a real random value; the upstream placeholder is a placeholder.
What you get: distributed monitoring agents that push server metrics, uptime checks with per-region probes, notification channels, and a public status page. What you do not get: isolation. Tianji, its Postgres and your status page all live on infrastructure you must keep alive. That is fine for a homelab and wrong for “prove my datacenter is down”.
UptimeFlare — checks from the edge, free
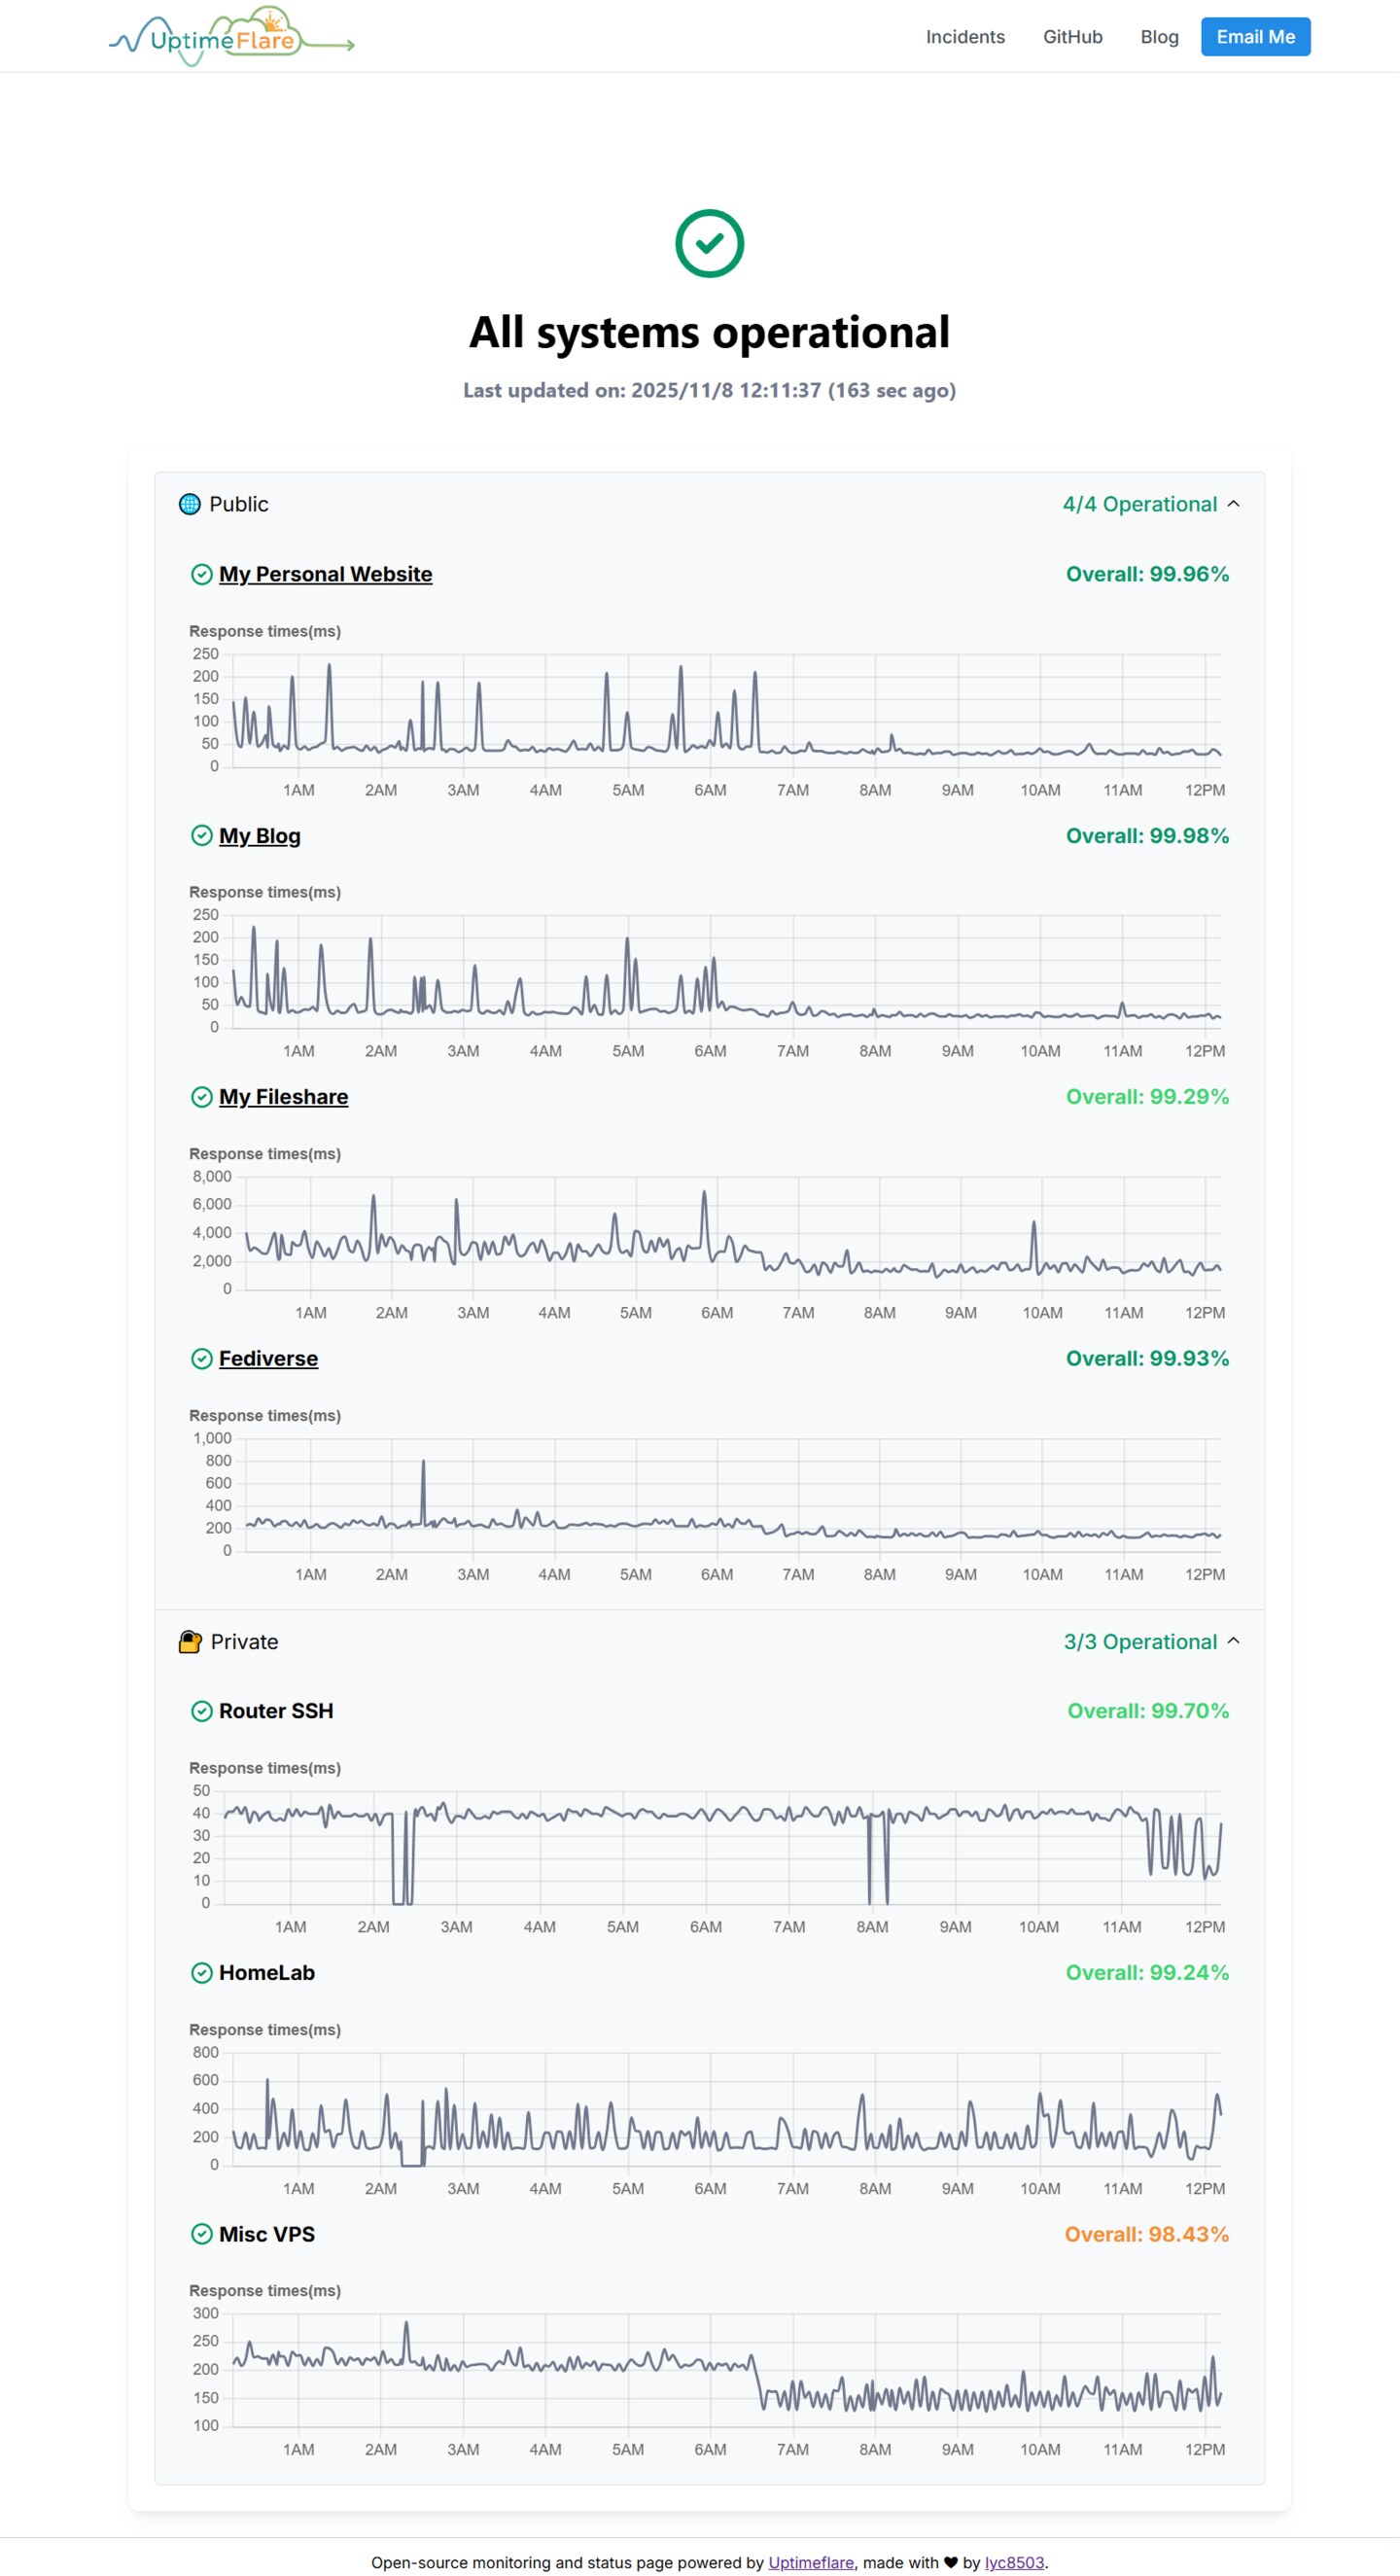
UptimeFlare (3,937 stars, Apache-2.0, TypeScript) is the architectural opposite: there is no server. Monitors are defined in a TypeScript config, deployed as a Cloudflare Worker, with results stored in Cloudflare D1 and a status page served from the same edge.
The upstream feature set is unusually concrete for a free tool: up to 50 checks at 1-minute intervals, probes from more than 310 cities, response-time charts, scheduled maintenance windows, incident history, a JSON API, optional password protection, and downtime notifications through Apprise’s 100+ channels.
| |
A monitor entry in uptime.config.ts follows the shape below — the important part is that checkProxy sends the probe through a remote region, so the request does not originate from your laptop or your VPS:
| |
The security note is not hypothetical. A configuration-exposure vulnerability (CVE-2026-29779) affected versions between September 2025 and March 2026, exposing monitor configuration and credentials to clients. If you deployed in that window, upgrade — and generally, keep secrets out of anything the Worker serves to browsers.
The trade-off is that you are building on rented ground: Cloudflare’s free tier is generous (which is why this costs nothing), but you inherit its limits, its outages, and its terms.
Checkup — distributed checks with no central brain
Checkup (3,463 stars, MIT, Go) was created by Matt Holt — the author of Caddy — and is maintained by Sourcegraph. It is the only one of the three that treats the checker as a fleet: any number of agents run checkup on a schedule, write results as JSON to shared storage, and the status page is rendered from that storage.
That design has a consequence worth stating plainly: there is no database to lose and no app server to crash. If your primary site is gone, the status page still renders from S3 or a local file.
Checkers: HTTP, TCP (+TLS), DNS, TLS certificate expiry. Storage: S3, local filesystem, GitHub, MySQL, PostgreSQL, SQLite3. Notifiers: whatever integration you configure.
checkup.json, following the upstream schema:
| |
| |
The cost is configuration discipline. You own the cron schedule, the storage lifecycle, the notifier wiring and the upgrade path. In exchange, Checkup answers the question Tianji and UptimeFlare cannot answer as cleanly: did the check from Frankfurt see the same thing as the check from São Paulo?
Pitfalls that will bite you
- Single-vantage monitoring lies. A check from the same VPS that hosts the site cannot distinguish “the site is down” from “the VPS is down”. Use at least two vantage points; UptimeFlare’s geo checks and Checkup’s multi-agent model both solve this natively.
- Green status is not health. A 200 from
/proves a web server answered, not that the database is reachable. Point checks at dependency-aware endpoints (/healthzthat touches Postgres and cache). - Alert storms are an outage of their own. Group notifications, set cooldowns, and never page on a single failed probe — require two or three consecutive failures.
- Free tiers have hard numbers. UptimeFlare caps at 50 checks at 1-minute intervals; exceeding it silently degrades to longer intervals. Count your monitors before you trust the graph.
- Keep the status page independent. If the status page is served by the same app that serves production, it is decorative. Static-rendered pages from object storage (Checkup’s model) survive real outages.
- Secrets in client-served config. The CVE-2026-29779 lesson generalizes: anything the browser can fetch is public. Treat status-page config as public data.
The verdict
Pick UptimeFlare if you want the best coverage-per-dollar and are comfortable with Cloudflare in the critical path — it is the only option here that gives you 300+ vantage points for zero infrastructure. Pick Checkup if uptime evidence has to survive your own infrastructure failure, or if you need multi-region corroboration and static status pages. Pick Tianji if you would rather have one pane of glass for analytics and uptime and you accept the shared blast radius.
Most teams should run two: UptimeFlare from the edge for external truth, plus a self-hosted panel for internal service checks.
If you are still picking a self-hosted monitoring panel, our Gatus vs k6 vs Uptime Kuma comparison covers the container-native options. For cron and batch job heartbeats, see Healthchecks vs Uptime Kuma vs Prometheus. And if you need a public status page with a design-first workflow, OpenStatus vs Kener vs Cstate is the next read.
FAQ
Is it safe to self-host uptime monitoring on the same server as my website?
No — that setup cannot detect the failure that matters most. If the host dies, the monitor dies and the alert never fires. Self-host the dashboard if you want one, but pair it with an external checker (edge-based or a second machine) that watches from outside your infrastructure.
Does UptimeFlare really cost nothing?
For most small setups, yes: Cloudflare Workers, D1 and the status page fit inside the free tier, and the project documents up to 50 checks at one-minute intervals. Costs appear if you exceed the free request quotas, need higher frequency, or want a paid plan for support and higher limits.
How is Checkup different from a normal uptime monitor?
Checkup separates the checker from the collector. Any number of agents can run checkup from different networks and write results to shared storage (S3, Postgres, MySQL, SQLite3, or a local file), and the status page renders from that storage. You are not watching one process — you are aggregating independent observations.
Which tool alerts fastest when a site goes down?
Alert latency is dominated by check interval plus consecutive-failure threshold, not by the tool. A one-minute interval with a two-failure threshold gives roughly two to three minutes of detection time. UptimeFlare’s one-minute floor and Checkup’s cron-driven schedule both reach that; Tianji’s defaults are usually looser, so tune the interval explicitly.
Can I migrate from Uptime Kuma without losing history?
Not automatically in most cases. Kuma stores data in SQLite and exposes an API, so history export is possible but tool-specific, and none of these three import Kuma’s schema natively. In practice teams run both for a week, compare results, then retire the old instance — which also validates that the new checker sees the same failures.
💰 想测试你的市场判断力?我用 Polymarket 做预测市场交易——这是全球最大的预测市场平台,从大选结果到技术监管时间线,什么都可以押注。和赌博不同,这是真正的信息市场:你懂的信息越多,胜率越高。我靠预测技术相关事件的走向已经赚了不少。用我的邀请链接注册:Polymarket.com