Your Proxmox cluster does not fail loudly. It fails on a Tuesday at 03:14, when the nightly PBS backup job silently writes 4 KB instead of 40 GB, or when a ZFS pool crosses 95% and every VM’s disk starts throwing intermittent I/O errors. The built-in web UI shows you a nice green node list — and nothing else. No history, no alerting, no “this backup has failed three nights in a row” signal.
That is the gap Pulse, ProxMenux and a hand-rolled Prometheus + Grafana stack all try to close — from three completely different angles. I deployed all three against a three-node Proxmox VE 9 cluster with PBS, Ceph and a handful of Docker workloads, and this is what actually matters in production.
TL;DR — Quick Verdict
- Choose Pulse if you want a single container that watches Proxmox, PBS, Docker and TrueNAS together and screams at you when a backup fails. It is the fastest path from zero to useful alerting.
- Choose ProxMenux if you also want to fix the host — post-install tuning, backup/restore, repository repairs — from one menu, with a lightweight web dashboard attached.
- Choose Prometheus + Grafana if you already run pve-exporter or node_exporter for other systems and want one queryable metrics store with long retention. It is the most work and the most flexible.
For most homelabs and small offices in 2026, Pulse wins the “actually deploy it” contest, and the metrics stack wins the “explain last month’s outage” contest.
Comparison table
| Dimension | Pulse | ProxMenux | Prometheus + Grafana |
|---|---|---|---|
| License | MIT | GPL-3.0 | Apache-2.0 |
| GitHub stars | 7,097 | 3,308 | n/a (multi-project stack) |
| Last commit | 2026-11-13 | 2026-11-13 | continuous |
| Primary language | Go | Python | Go + TypeScript |
| Deployment | Docker container | Bash installer + systemd | 3–5 containers |
| Proxmox VE coverage | Nodes, VMs, containers, storage, PBS | Host config + live dashboard | Anything pve-exporter exposes |
| Cross-platform coverage | Docker, Kubernetes, TrueNAS, vSphere | Proxmox only | Anything with an exporter |
| Alerting | Built-in (backup failures, disks, nodes) | Limited | Alertmanager (powerful, verbose) |
| Retention | Built-in history | Short | Unlimited (depends on disk) |
| Setup time (realistic) | 10 minutes | 5 minutes | 2–4 hours |
| Learning curve | Flat | Flat | Steep |
Decision matrix: pick by situation, not by feature list
| Your situation | Use this | Why |
|---|---|---|
| “My backup job quietly stopped working” | Pulse | It alerts on failed PBS backups and stale snapshots out of the box |
| “I want one dashboard for Proxmox, Docker and my NAS” | Pulse | Proxmox, Docker, TrueNAS and Kubernetes in a single view |
| “I just installed Proxmox and want it tuned correctly” | ProxMenux | Post-install menu handles repos, microcode, IOMMU, backups |
| “I run 40 hosts and need capacity planning” | Prometheus + Grafana | Long retention, PromQL queries, Grafana forecasting |
| “I need to prove uptime to a client” | Prometheus + Grafana | Alertmanager silences, Grafana annotations, exportable reports |
| “I have 3 nodes and 20 minutes” | Pulse | Compose file is 20 lines, no exporters to babysit |
Pulse — the one that actually alerts
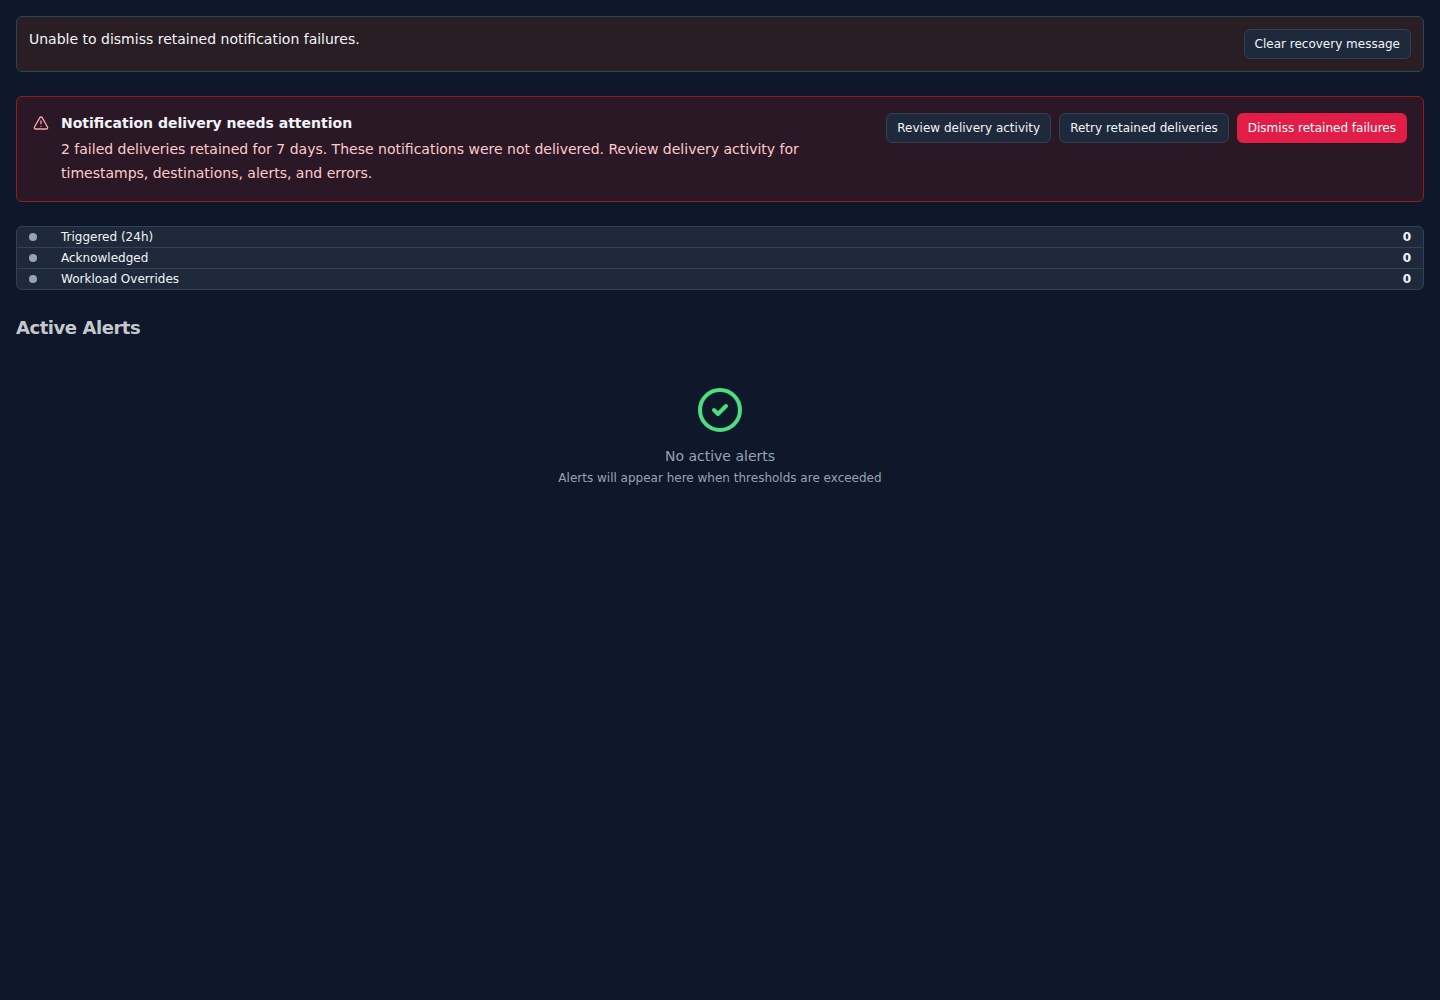
Pulse (7,097 stars, MIT, Go) is the newest serious entrant and the one that behaves like an operations tool rather than a pretty graph. It polls the Proxmox API, the PBS API, the Docker socket and optionally TrueNAS and vSphere, then evaluates conditions: node offline, storage above threshold, backup older than N hours, container restarting in a loop.
The deployment is the whole argument. This is the upstream docker-compose.yml, fetched from the repository rather than reconstructed from memory:
| |
| |
Two details separate Pulse from hobby dashboards. First, the healthcheck has a real fallback path — a failed image probe stays failed instead of silently retrying on another protocol, which is exactly the bug that makes container monitoring untrustworthy. Second, backup monitoring is a first-class citizen: it knows a PBS datastore’s last successful snapshot per guest and computes staleness, instead of just graphing throughput.
What it does not do: long-term capacity planning. History is bounded and the query language is “what the UI shows you”. If you need “show me storage growth per node over 12 months”, you are in the wrong tool.
ProxMenux — the toolkit that fixes the host
ProxMenux (3,308 stars, GPL-3.0, Python) is not really a monitoring product. It is an interactive Proxmox toolkit — a menu-driven CLI plus a web dashboard — that grew a monitoring arm. If your actual pain is “this node was installed by someone who never set up the no-subscription repo, never enabled IOMMU and has no backup rotation”, ProxMenux solves more problems per minute than any dashboard.
Install from the host’s own terminal, not from a container:
| |
The installer registers proxmenux-monitor.service, so the web dashboard comes up on boot without you writing unit files. From the menu you get post-install hardening, repository fixes, kernel and microcode management, GPU passthrough checks, backup and restore of host configuration, and hardware inventory.
The honest trade-off: ProxMenux is Proxmox-shaped. It has no concept of Docker containers on a NAS, no cross-cluster view, and its alerting is thinner than Pulse’s. It is also the tool most likely to touch your host configuration — which is precisely why it is valuable, and precisely why you should read the script before running it. The upstream README even tells you to do that.
Use it as a one-time hygiene pass plus a light dashboard, not as your alerting backbone.
Prometheus + Grafana — the stack you build yourself
The DIY route needs pve-exporter (or node_exporter on each host), Prometheus, Alertmanager and Grafana. Nothing about it is difficult; it is just four moving parts that each fail independently.
A minimal scrape configuration for pve-exporter looks like this:
| |
| |
The payoff is PromQL. “Which guests grew their disk more than 20% in 30 days” is one query. “Alert me when the Ceph pool’s projected fill date is under 14 days” is a Grafana alert rule. Alertmanager then gives you routing, grouping, silences and inhibition — the things you miss the day you get 400 identical alerts because one switch rebooted.
The cost is real: retention eats disk, exporter tokens need rotating, Grafana dashboards drift, and someone has to own the stack. In exchange you get a metrics store that answers questions nobody thought to hardcode.
Pitfalls that will bite you
- Monitoring through the GUI only hides the failure mode that matters. A green node with a 96%-full pool looks identical to a green node with space. Alert on trends and staleness, not on colors.
- Do not poll the Proxmox API as root. Create a read-only API token (
PVEAuditoron/) for Pulse and pve-exporter. Root tokens in a monitoring stack are an incident waiting to happen. - Backup monitoring needs the PBS datastore, not the VM list. A “successful” snapshot that deduplicates to a few megabytes is not a backup. Verify restore, not just job status.
- Docker socket mounts are root-equivalent. If you give a dashboard
/var/run/docker.sock, put it behind SSO or at least a VPN — that socket is a host takeover primitive. - Exporter sprawl kills homelabs. Every exporter adds a port, a token and an upgrade path. Start with Pulse, add Prometheus only when you have a question it cannot answer.
- Retention defaults are too long. Prometheus at 15 s scrape intervals across 40 hosts will fill a small disk in weeks. Set
--storage.tsdb.retention.timedeliberately.
The verdict
Deploy Pulse today. It is MIT-licensed, one container, and it catches the failure that actually costs you a weekend — a silently dead backup. Add ProxMenux on the hosts themselves, once, to fix the configuration debt that monitoring keeps exposing. Reach for Prometheus + Grafana when you need history and queries, not before; the stack is excellent but it is a commitment, not a dashboard.
If you are still choosing your virtualization layer, our Proxmox VE vs XCP-ng vs oVirt comparison covers the trade-offs. Once you run more than one cluster, read ProxCenter vs PegaProx vs Proxmox Datacenter Manager before you build a bespoke control plane. And if you prefer a single binary over a metrics pipeline, see our Beszel lightweight server monitoring guide.
FAQ
Is Pulse a replacement for Prometheus?
For homelabs and small clusters, yes — Pulse covers node, storage, backup and container health with built-in alerting and needs no exporters. It is not a replacement for a time-series database: if you need arbitrary queries, long retention or capacity forecasting, keep Prometheus as the metrics store and use Pulse for day-to-day alerting.
Do I need to install an agent on every Proxmox node?
No. Pulse talks to the Proxmox API over the network and needs one read-only API token. ProxMenux installs on the host itself because it changes host configuration (repositories, kernel modules, IOMMU), which is a different job. Prometheus needs pve-exporter, which can run once per cluster.
Which one alerts on failed PBS backups?
Pulse does this natively: it reads the Proxmox Backup Server datastore and computes, per guest, how old the last successful snapshot is, then alerts when it exceeds your threshold. With the DIY stack you have to scrape PBS metrics and write the alert rule yourself, which is easy to get subtly wrong.
Can ProxMenux break my cluster?
It can change host configuration, so treat it like any root-level tool: read the installer, run it on one node first, and keep a snapshot. The menu-driven design reduces typos, but it does not remove the risk of a repository switch or kernel change on a production host.
What is the minimum useful monitoring setup for three nodes?
One Pulse container with a read-only Proxmox token, plus one PBS connection if you use Proxmox Backup Server, plus a notification channel. That gives you node-down, storage-full and backup-stale alerts in about ten minutes, which covers the failures that actually take services offline.
💰 想测试你的市场判断力?我用 Polymarket 做预测市场交易——这是全球最大的预测市场平台,从大选结果到技术监管时间线,什么都可以押注。和赌博不同,这是真正的信息市场:你懂的信息越多,胜率越高。我靠预测技术相关事件的走向已经赚了不少。用我的邀请链接注册:Polymarket.com