Your p99 latency just jumped from 40 ms to 780 ms and nobody deployed anything. CPU looks fine. Heap looks fine. Then someone remembers the JVM has been writing a GC log for six months and nobody has ever opened it.
That file is the single most detailed record of what your memory management subsystem actually did — every young collection, every mixed collection, every humongous allocation, every promotion spike. The problem is that a modern unified logging GC file is hundreds of megabytes of lines like [2026-11-04T07:12:01.884+0000][info][gc,phases] GC(4821) Pre Evacuate Collection Set: 0.4ms. Humans do not read that. Tools do.
But the tooling landscape is a mess: the most popular analyzer, GCViewer, is a Swing desktop app with a 2008-era codebase; Microsoft’s GCToolKit is a proper library with an API but no UI; and the newer jvm-gc-logs-analyzer is the only one that actually understands modern G1/ZGC phase-level logging. Picking the wrong one wastes a day.
TL;DR / Quick Verdict
If you have one incident to debug today and you want charts in five minutes, use GCViewer. It is a single JAR, it opens any log format from Java 6 through 21, and it renders the pause and heap charts that answer 80% of questions.
If you need this inside a pipeline — a nightly job that flags regressions, a capacity report, a service that ingests GC logs from 400 pods — use GCToolKit. It parses logs into typed events and gives you an aggregation API. It is a library, not a product.
If you are on Java 11+ with unified logging and you care about phase-level detail (evacuation, reference processing, remark, cleanup), use jvm-gc-logs-analyzer. It is the only one of the three that decomposes a single G1 collection into its internal stages and shows you an allocation rate chart that is trustworthy.
Do not use GCPlot. It has been dead since 2018 and cannot parse unified logging (-Xlog) output at all.
| Dimension | GCViewer | GCToolKit | jvm-gc-logs-analyzer |
|---|---|---|---|
| GitHub | chewiebug/GCViewer | microsoft/gctoolkit | krzysztofslusarski/jvm-gc-logs-analyzer |
| Stars | 4,645 | 1,300 | 129 |
| Last push | 2026-06-20 | 2026-11-02 | 2026-04-21 |
| License | GPL v2 (fork of a 2008 codebase) | MIT | Check repo before shipping |
| Interface | Swing desktop GUI + CLI export | Java library / API | Swing standalone + web JAR |
| Latest release | 1.36 | 3.7.0 | Release JARs on GitHub |
| Log formats | Pre-unified + unified (partial) | Pre-unified + unified | Unified only, Java 11+ |
| Best at | Fast visual triage | Automation and custom aggregation | Phase-level G1/ZGC forensics |
| Worst at | No automation, dated UI | No UI, you write the reporting | No Java 8, strict decorator requirements |
Decision Matrix: Which Analyzer for Which Job
| Use case | Recommended tool | Why |
|---|---|---|
| One-off “why did this app pause” investigation | GCViewer | Open the log, look at the pause chart, done in under two minutes |
| Nightly regression check across builds | GCToolKit | Typed events + aggregation API; emit your own metrics |
| Ingest GC logs from a Kubernetes fleet | GCToolKit | MIT license, library-first, no GUI to work around |
| Reducing a 900 MB log to a 40-line summary | GCViewer CLI -t SUMMARY | Text-only mode, no window manager needed on a server |
| Understanding G1 evacuation failures | jvm-gc-logs-analyzer | Per-phase timing tables the others do not produce |
| Java 8 or older JVM | GCViewer | It is the only one that reliably parses pre-unified logs |
| Reporting to non-engineers | jvm-gc-logs-analyzer web JAR | Browser UI, shareable link, no desktop install |
GCViewer — The Pragmatic Default
GCViewer is the tool most JVM engineers have used at least once, and for good reason: it does one thing and it does it without configuration. Point it at a log, get a chart of heap occupancy with pause times overlaid, a summary table of throughput and maximum pause, and a list of the individual collections that exceeded your threshold.
4,645 stars, last pushed 2026-06-20, version 1.36 on Maven Central. The project is a maintained fork of tagtraum industries’ original tool, which stopped development in 2008 — so the UI looks its age, but the parser has been kept current through G1 and the unified logging format.
The CLI mode is what makes it usable in operations:
| |
If you want it as a dependency rather than a binary, it is published under com.github.chewiebug:gcviewer:1.36. Be aware of the license before you embed it in a commercial product — it is GPL-derived.
Real limitation: GCViewer answers “how bad was it” but not “which phase was bad”. When a G1 mixed collection takes 340 ms, GCViewer shows you the 340 ms bar. It will not tell you that 290 ms of it was in Evacuate Collection Set because the evacuation ran out of regions to copy into. For that you need phase data.
GCToolKit — Turning Logs Into Typed Events
Microsoft’s GCToolKit is the opposite design philosophy: it is not an application, it is a parser plus a model plus an aggregation API. That makes it dramatically more useful than GCViewer if your problem is “I need this answer for 400 JVMs every night” and dramatically less useful if your problem is “I want to look at a chart”.
1,300 stars, MIT licensed, last pushed 2026-11-02, version 3.7.0 on Maven Central. It parses both pre-unified and unified HotSpot logs and turns them into discrete events (GCPauseEvent, HeapSummary, SurvivorRecord, and so on), which you then summarize with aggregators.
Add the three modules — api, parser, vertx — under the com.microsoft.gctoolkit group:
| |
The canonical usage pattern is small enough to paste into a build step:
| |
Two things make GCToolKit worth the extra setup. First, loadAggregationsFromServiceLoader() means you get HeapOccupancyAfterCollectionSummary, CollectionCycleCountsSummary and PauseTimeSummary for free — those three cover committed heap after collection, per-collector cycle counts, and pause distributions. Second, writing your own Aggregation is a normal Java class, not a plugin system, so a regression check becomes “compare this run’s pause percentiles to the 30-day median and fail the build above a threshold”.
Stack requirement note: the vertx module has historically pinned a Vert.x version. If your application already uses a much newer or older Vert.x, keep the GC analysis in a separate module or process rather than dragging the dependency tree around. The GCToolKit sample does exactly this — it runs as its own module via --module-path.
jvm-gc-logs-analyzer — Phase-Level Forensics
This is the newest and least-known of the three, and it exists because its author needed answers the other two could not give. It is written by a JVM performance engineer and targets Java 11+ unified logging only — which in 2026 is not a limitation for most teams, but is fatal if you still run Java 8.
129 stars, last pushed 2026-04-21. Two artifacts: a standalone Swing application (fast, local) and a web application that powers the hosted service.
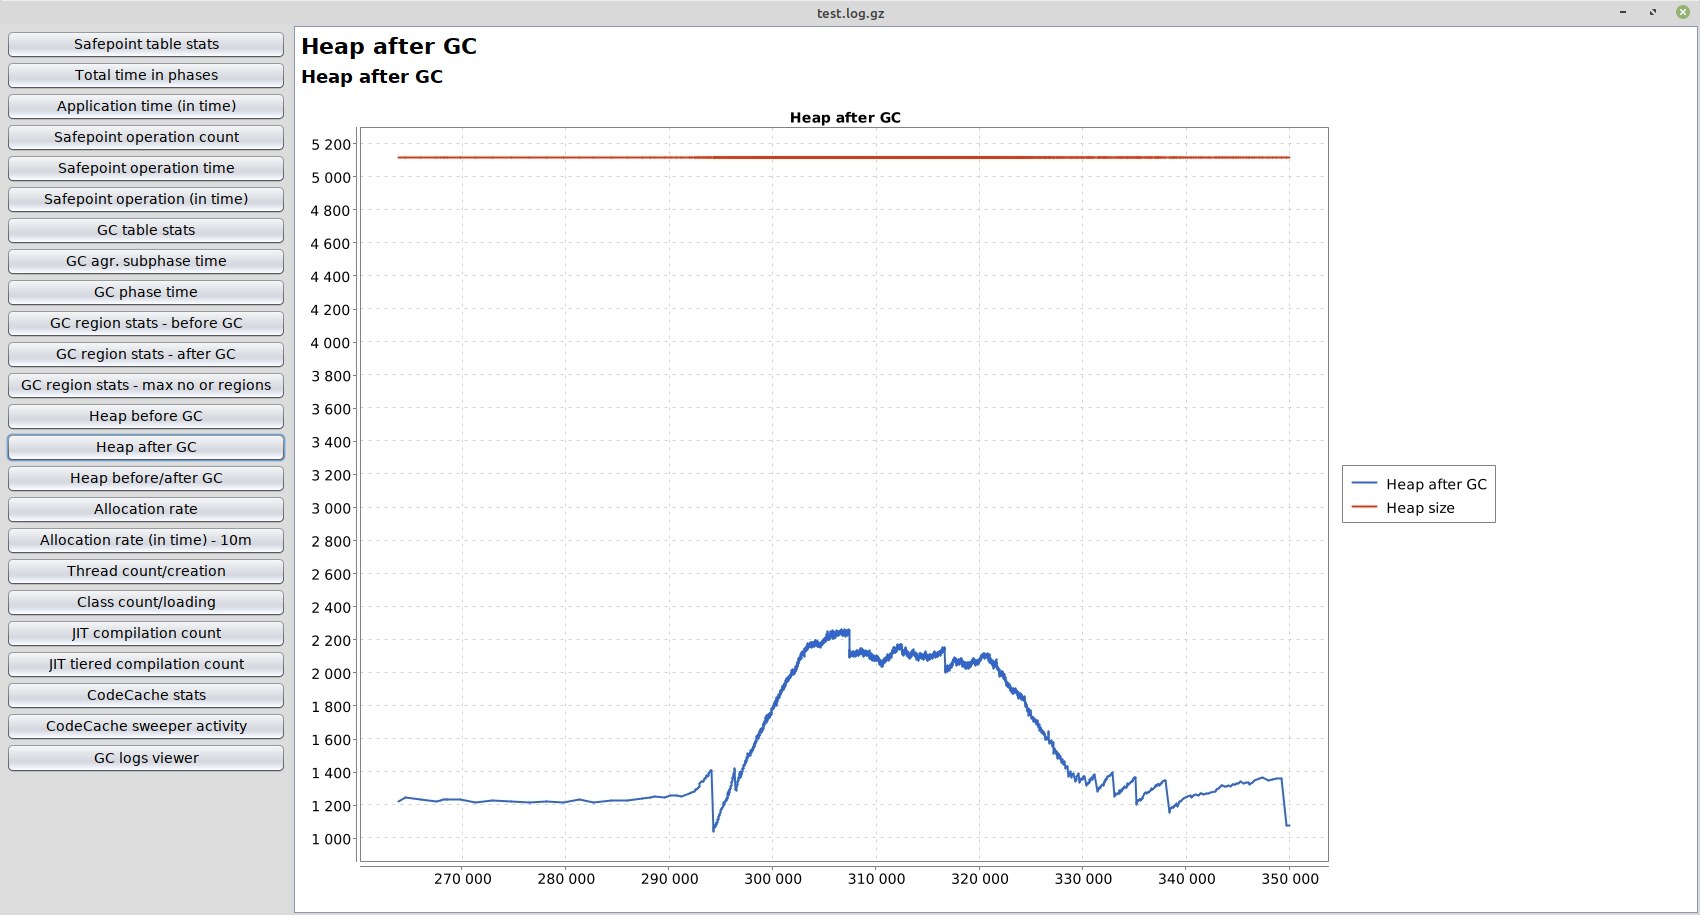
Build it yourself in three commands, or take a release JAR:
| |
The reason to choose it is the decorator requirement, which is also its biggest trap. The tool needs a specific, verbose tag set — this is the configuration the README documents:
| |
gc+phases=trace is the important part. Without it you get no phase breakdown and the tool’s main advantage disappears. With it, you get per-collection tables for evacuation, reference processing, remark, cleanup and the concurrent cycle, plus an allocation-rate chart derived from heap deltas rather than guessed from collection frequency.
The catch: log volume. gc+phases=trace on a busy 16 GB heap can produce several gigabytes per day. Rotate aggressively (filecount=10,filesize=50M above), and parse offline rather than streaming.
Pitfalls That Cost Real Hours
GC logs are not enabled by default, and enabling them after an incident gives you nothing. If you take one thing from this article: add -Xlog:gc*:file=...:time,uptime,level,tags:filecount=10,filesize=50M to every production JVM today. The overhead is negligible; the absence of the file during an outage is expensive.
Unified logging broke every old parser. Anything written for -XX:+PrintGCDetails output will silently produce empty charts on a -Xlog file. If a tool shows “no data” on a modern JVM, this is why — not a corrupt log.
time without uptime loses ordering across restarts. Multi-file, multi-restart analyses need both decorators, plus level and tags so the parsers can distinguish gc,phases from gc,heap lines.
Throughput numbers lie if the log window is not representative. A GCViewer SUMMARY of “99.4% throughput” computed over a quiet overnight window says nothing about the 09:00 traffic peak. Always slice the log by time window before drawing conclusions, and compare the same window day over day.
Do not tune -Xmx from a pause chart alone. Maximum pause is a symptom. The cause is usually allocation rate or a promotion spike from a too-small survivor space. GCToolKit’s HeapOccupancyAfterCollectionSummary and the analyzer’s allocation-rate chart are what tell you whether you are chasing the right knob.
Loading a 900 MB log into a Swing app will exhaust your own heap, not the JVM’s. Run the desktop tools with -Xmx4g and consider pre-filtering with grep on the time window you care about.
If you are choosing a profiler rather than a log analyzer, that is a different decision — see our JVM profilers comparison for async-profiler, JFR and VisualVM. If what you actually need is production-wide visibility rather than single-JVM forensics, our self-hosted Java APM guide covers Scouter, Glowroot and Kamon. And if your pauses turn out to be an OS-level problem rather than a collector problem, the Linux performance profiling guide is the next stop.
FAQ
Which GC log analyzer should I use in 2026?
Use GCViewer for quick visual triage, Microsoft GCToolKit when you need GC analysis inside an automated pipeline, and jvm-gc-logs-analyzer when you need phase-level detail on a Java 11+ JVM. They are complementary, not competing — many teams keep GCViewer for humans and GCToolKit for CI.
Does GCViewer support Java 17 and Java 21 unified logging?
Yes, version 1.36 parses unified (-Xlog) logs, but its model is collection-level, so you get pause and heap charts without the internal phase breakdown. For pre-unified formats from Java 8 and earlier it remains the most reliable option of the three.
Is GCToolKit a replacement for GCViewer?
No. GCToolKit has no user interface — it is a library that turns a GC log into typed events and aggregations. It replaces GCViewer only in the sense that you can build your own reporting on top of it, which is exactly what you want at fleet scale and exactly what you do not want during a live incident.
What JVM flags do I need to capture a usable GC log?
At minimum -Xlog:gc*:file=/var/log/app/gc.log:time,uptime,level,tags:filecount=10,filesize=50M. Add gc+phases=trace and gc+humongous=trace if you intend to use jvm-gc-logs-analyzer, since it requires the verbose decorator set to produce phase tables.
How much overhead does GC logging add?
Unified logging with the gc* tag set is well under one percent of throughput for typical services. The cost that surprises people is disk I/O and volume: with phase tracing enabled on a large heap, plan for gigabytes per day and rotate with filecount and filesize.
Can I analyze GC logs from Kubernetes pods centrally?
Yes, and GCToolKit is the right tool for it. Ship the rotated log files out of the pod (sidecar or node-level collector), then run a GCToolKit aggregation job per file and store the resulting pause and occupancy summaries alongside your other metrics. Building a parser yourself from regexes over -Xlog output is the mistake to avoid — the decorator combinations are more varied than they look.
Is GCPlot still usable?
No. GCPlot has not been updated since 2018 and predates unified logging, so it cannot parse -Xlog output. It is sometimes still recommended in older blog posts; ignore those recommendations.
💰 想测试你的市场判断力?我用 Polymarket 做预测市场交易——这是全球最大的预测市场平台,从大选结果到技术监管时间线,什么都可以押注。和赌博不同,这是真正的信息市场:你懂的信息越多,胜率越高。我靠预测技术相关事件的走向已经赚了不少。用我的邀请链接注册:Polymarket.com