Your Java service holds a 400 ms p99 while CPU sits at 35 percent. Nothing in the logs explains it, Grafana shows healthy heap, and the on-call engineer’s usual move — restart and hope — buys six quiet hours. This is the exact situation where the profiler you pick decides whether you find the cause in twenty minutes or twenty days.
The problem is that “JVM profiler” is three different tools wearing one name. async-profiler is a sampling profiler built on AsyncGetCallTrace and perf_events. JDK Flight Recorder (JFR), analyzed in JDK Mission Control (JMC), is a always-available event recorder baked into every modern JDK. VisualVM is the Swiss-army GUI that wraps the JDK’s own command-line tools. They overlap just enough to be confusing and differ enough that picking wrong wastes a week.
TL;DR: The 30-Second Verdict
- Production incident, CPU or allocation hot spot, container or bare metal: use async-profiler 4.6. It is the only one of the three that avoids safepoint bias, it sees native and kernel frames, and it produces a flame graph you can read in a browser without a GUI.
- Always-on recording with forensic value, near-zero overhead, no extra binary to ship: use JFR + JMC. JFR is already inside the JDK;
jcmdstarts a recording on a running process, and JMC turns the file into an automated rule report. - Local development, heap dumps, thread dumps, quick “who is holding this object” questions: use VisualVM 2.2.2. It is the fastest path to a heap histogram and it ships a VS Code integration.
If you only remember one line: async-profiler for the hot path, JFR for the always-on black box, VisualVM for the developer laptop.
Side-by-Side Comparison (data pulled from GitHub, November 2026)
| Dimension | async-profiler 4.6 | JFR + Mission Control 9.1 | VisualVM 2.2.2 |
|---|---|---|---|
| GitHub stars | 9,185 | 993 (openjdk/jmc) | 3,277 (oracle/visualvm) |
| Latest activity | pushed 2026-10-27, release v4.6 on 2026-10-19 | pushed 2026-10-26, tag 9.1.2-ga | pushed 2026-10-26, release 2.2.2 on 2026-09-08 |
| License | Apache-2.0 | UPL 1.0 | GPLv2 with Classpath Exception |
| Sampling mechanism | AsyncGetCallTrace + perf_events, no safepoint required | JVM-internal event recorder (JFR) | JVM Tool Interface / JMX sampling |
| Safepoint bias | No | No (event-based, not sampler) | Yes — samples land at safepoints |
| Native / kernel frames | Yes | Partial (native events, limited stacks) | No |
| Allocation profiling | Yes, TLAB-level, -e alloc | Yes, allocation events in profile settings | Yes, sampler + heap dump analysis |
| Lock contention | Yes, -e lock | Yes, Java monitor events | Limited |
| Typical overhead | 1–3 percent CPU-mode; higher in alloc mode | Under 1 percent with profile settings | 2–10 percent while sampling |
| Works in Docker/K8s | Yes, with perf_event_open caveats | Yes, no privileges needed | Awkward — GUI needs a display |
| Attach to running JVM | Yes, asprof <pid> | Yes, jcmd <pid> JFR.start | Yes, local or JMX remote |
| Output | HTML/SVG flame graph, JFR, collapsed stacks, heatmap | .jfr binary + JMC rule report | Live GUI charts, .nps snapshots, .hprof |
Decision Matrix: Pick in Ten Seconds
| Your situation | Pick | Why |
|---|---|---|
| p99 latency spike in production, need the cause now | async-profiler | Flame graph in 30 seconds, no restart, no GUI |
| You want a recording that is always running so the next incident is already captured | JFR | Built into the JDK, sub-1 percent overhead, dump on demand |
| You must explain a regression to non-Java stakeholders | JFR + JMC | Automated rule-based analysis produces a readable report |
| Heap growing until OOM, need the retaining path | VisualVM (dump) + async-profiler (-e alloc) | Heap histogram first, allocation flame graph second |
| Crashed container, no shell access to the JVM | JFR with -XX:StartFlightRecording | Starts at boot, writes to a mounted volume |
| Lock contention in a thread pool | async-profiler -e lock | Shows the monitor and the blocking stack directly |
| Teaching a junior engineer how profiling works | VisualVM | Visual, immediate, zero setup |
| CI performance gate | JFR (jcmd assertions) or async-profiler JFR output | Both emit machine-readable recordings |
async-profiler 4.6: The Incident Responder
async-profiler is the tool you reach for when the building is on fire. Its key architectural advantage is that it does not wait for a safepoint: it walks stacks with AsyncGetCallTrace and correlates them with perf_events, so short-lived methods that never reach a safepoint still appear in the profile. It also shows native frames, which is why it can tell you that your “Java” latency is actually epoll_wait or a malloc arena lock.
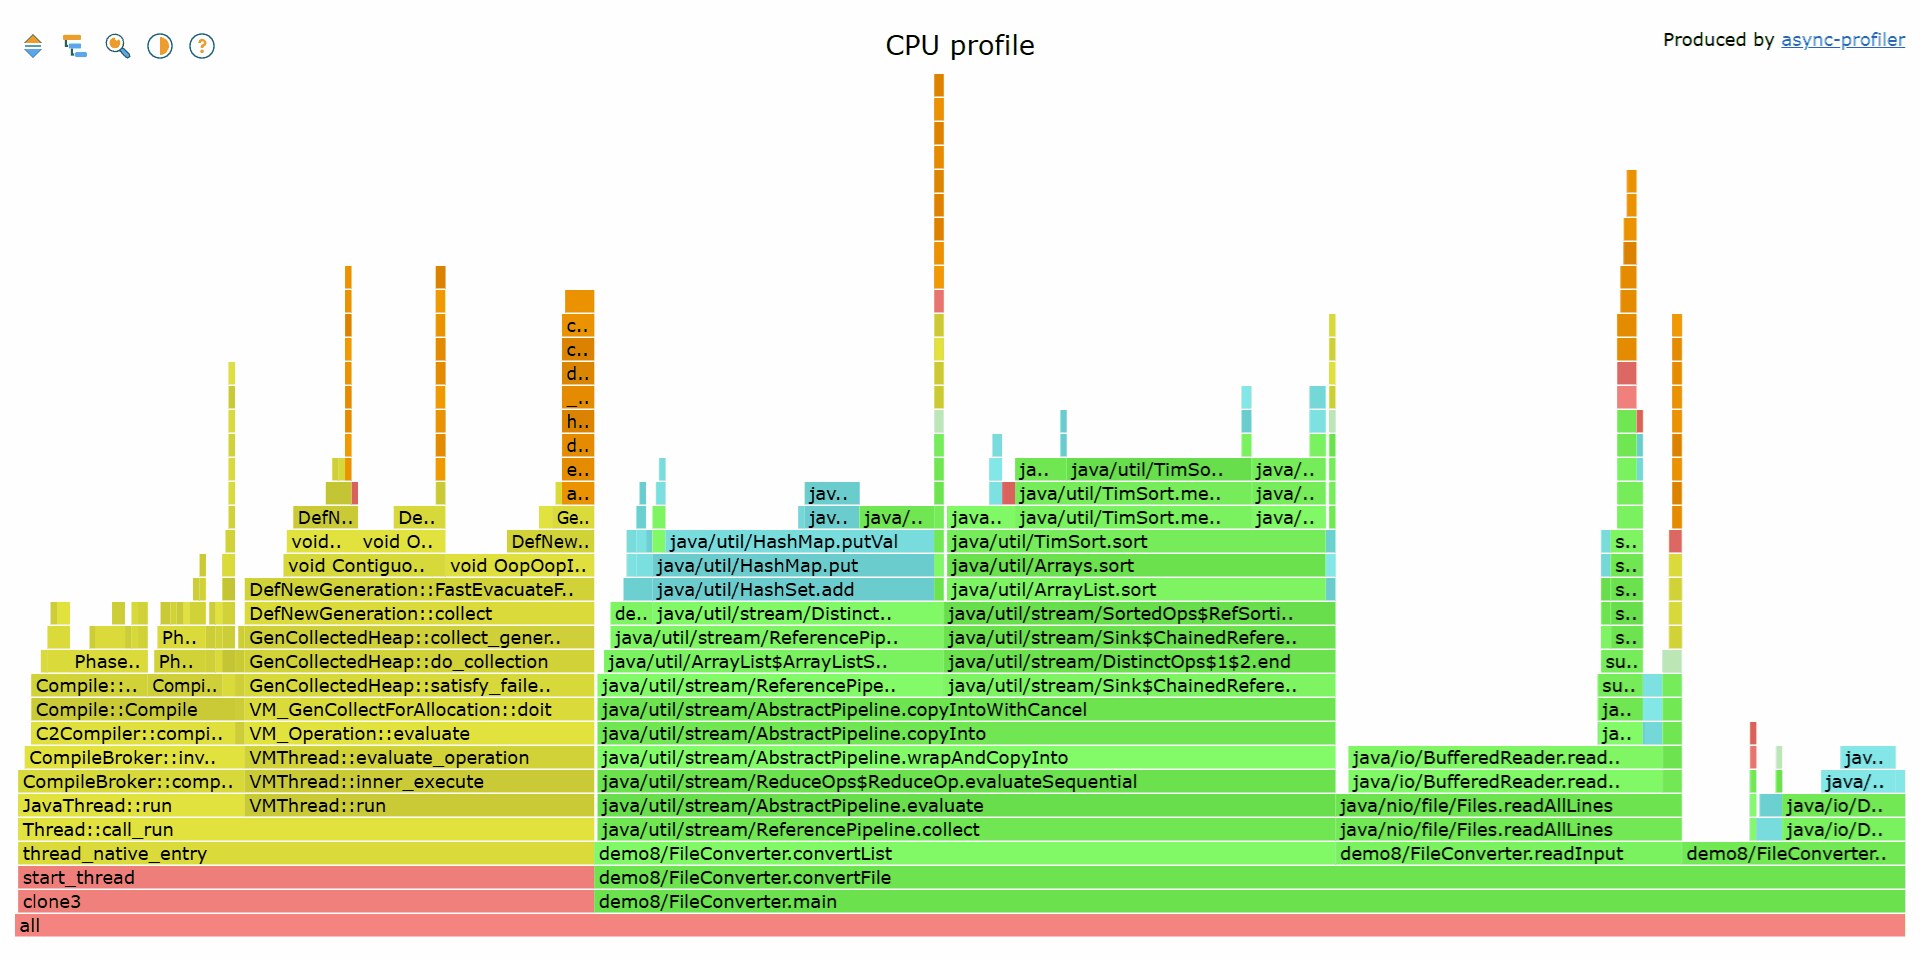
Install it from the official release tarball and profile a running process:
| |
Inside containers there is one trap worth memorizing: Docker blocks perf_event_open by default. The official container guide lists three fixes — relax seccomp (--security-opt seccomp=unconfined, sometimes plus CAP_SYS_ADMIN), use --fdtransfer, or fall back to the CPU-timer engine with -e ctimer. In managed Kubernetes clusters where you cannot change the security context, ctimer is the pragmatic answer even though it loses kernel frames.
JFR + Mission Control 9.1: The Black Box Recorder
JFR is the only profiler here that costs you nothing to deploy, because it is already in the JVM. The recording is a binary event stream: method samples, allocations, GC pauses, thread states, I/O, exceptions. Mission Control reads that stream and runs an automated analysis that flags things like “high thread contention” or “excessive garbage collection” without you having to read a flame graph.
| |
For crash forensics, put it in the container’s startup flags so the recording exists before the process misbehaves:
| |
Two settings matter more than the rest. settings=profile lowers the sampling interval from the 20 ms default to 10 ms and enables allocation sampling; the default profile is too coarse to catch short hot spots. And maxchunksize prevents a long-running recording from filling a small container volume, which is a genuinely common outage cause when JFR is enabled for the first time.
VisualVM 2.2.2: The Developer’s Workbench
VisualVM is not the fastest profiler here, and its sampler inherits safepoint bias, so it will happily miss a 200-microsecond method that async-profiler catches. What it does better than both alternatives is answer structural questions interactively: which class is consuming the heap, which thread is stuck, what the object graph looks like around a leak.
| |
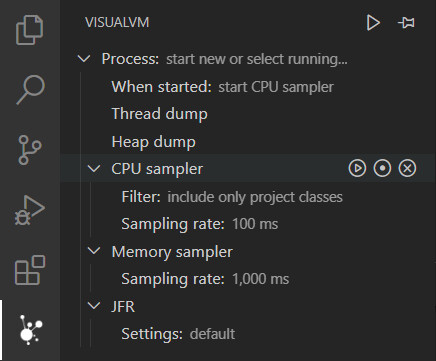
The 2.2.2 release line ships a VS Code integration, which matters more than it sounds: developers increasingly live in the editor, and being able to inspect a JVM without switching to a standalone Swing application removes real friction. VisualVM is GPLv2 with the Classpath Exception, so embedding it in internal tooling is legally uncomplicated.
Pitfalls That Cost Real Incidents
1. Trusting a profiler with safepoint bias for short methods. VisualVM’s sampler only observes threads at safepoints. A method that runs for 200 microseconds in a tight loop can dominate CPU while remaining invisible. If the flame graph looks suspiciously flat, re-run with async-profiler before you refactor anything.
2. Leaving allocation profiling on in production. Collecting allocation stacks is dramatically more expensive than CPU sampling. Run it for 30–60 seconds, capture the recording, and turn it off. Teams that leave -e alloc attached report 10–20 percent throughput loss and blame the JVM.
3. Using settings=default for JFR and concluding “JFR shows nothing”. The default profile samples too coarsely for latency work. Always use settings=profile for incident recordings and keep default for cheap always-on telemetry.
4. Forgetting perf_event_open inside containers. The symptom is asprof failing with a permission error or producing a profile with no kernel frames. Fix the seccomp profile or use -e ctimer — do not conclude that the profiler is broken.
5. Adopting an abandoned profiler. honest-profiler still has 1,253 stars but its last push was 2023-12-05. It does not support modern JDK class-file versions and will silently mis-attribute frames. Star counts are not maintenance.
6. Profiling a different heap than production. A 512 MB staging JVM with a 2 GB production heap produces a completely different GC and allocation profile. If you cannot profile production, at least match -Xmx, GC choice, and container CPU limits.
7. Attaching dynamically on JDK 21+ and ignoring the warning. Dynamic agent loading prints a warning and, on hardened builds, may be disabled entirely. For repeatable results, start the JVM with the agent or use JFR’s startup flags instead of asprof attach.
Related Reading
If you are still choosing a runtime, our GraalVM vs OpenJ9 vs HotSpot comparison covers how JIT behavior changes what a profiler shows. For build-time performance rather than runtime, see Gradle vs Maven vs SBT. And if you want the host-level view underneath the JVM, our Linux profiling with perf and flame graphs guide covers the kernel side.
FAQ
Which JVM profiler has the lowest overhead in production?
JFR with settings=profile is the cheapest option for continuous use, typically well under 1 percent overhead because recording happens inside the JVM as event buffers. async-profiler in CPU mode usually costs 1–3 percent and is the better trade when you need native frames and no safepoint bias. VisualVM’s sampler is fine for development but is not designed for sustained production use.
Can I use async-profiler in Kubernetes without privileged containers?
Yes, with caveats. The profiler needs perf_event_open, which the default Docker seccomp profile blocks. You can relax seccomp, use --fdtransfer, or fall back to -e ctimer, which needs no special privileges but loses kernel frames. On managed clusters where the security context is fixed, ctimer is usually the only available path.
Does JFR require a commercial JDK or a paid license?
No. JFR is part of OpenJDK and is available in every modern Temurin, Corretto, Zulu, and Liberica build. Mission Control is published under the Universal Permissive License 1.0 and is distributed by Adoptium, Azul, BellSoft, Oracle, and Red Hat. There is no license key and no per-node fee.
How do I find a memory leak: heap dump or allocation profile?
Use both, in that order. Take a heap dump with jcmd <pid> GC.heap_dump and inspect the dominator tree in VisualVM or Mission Control to find what is retained. Then run async-profiler with -e alloc for 60 seconds to see which call path creates those objects. The dump tells you what is alive; the allocation profile tells you who keeps creating it.
Is VisualVM still maintained in 2026?
Yes. The oracle/visualvm repository was pushed on 2026-10-26 and release 2.2.2 shipped on 2026-09-08, with a VS Code integration in the same line. It remains GPLv2 with the Classpath Exception and continues to bundle the JDK command-line tools behind a GUI.
💰 想测试你的市场判断力?我用 Polymarket 做预测市场交易——这是全球最大的预测市场平台,从大选结果到技术监管时间线,什么都可以押注。和赌博不同,这是真正的信息市场:你懂的信息越多,胜率越高。我靠预测技术相关事件的走向已经赚了不少。用我的邀请链接注册:Polymarket.com