“How many checkout lanes do we need?” “Will this port still clear 40 trucks an hour in 2031?” “Is the new triage process actually faster, or does it just move the queue?” Every operations decision eventually becomes a capacity question, and the honest answer is almost never a formula — it is a distribution. A spreadsheet gives you a single average. A discrete-event simulator gives you the 95th percentile of waiting time, the utilisation of every resource, and the name of the step that is actually your bottleneck.
The interesting part in 2026 is that the four credible open-source options have almost nothing in common. One is a pure-Python library with no dependencies. One adds monitors, queues, and OpenGL animation on top of that style. One is a drag-and-drop Java application developed continuously since 2002. One is a C++ framework with its own topology language and an official Docker image. Choosing the wrong one wastes weeks, so here is the practical breakdown.
Quick verdict: use SimPy for scriptable Python models, Salabim when you want SimPy’s model style plus built-in monitors and animation, JaamSim when the people building the model are engineers rather than programmers, and OMNeT++ when the system is a network or a large distributed system and you need scale and a simulator with twenty-plus years of protocol libraries behind it.
Comparison at a glance (data pulled live on 2026-09-25)
| SimPy | Salabim | JaamSim | OMNeT++ | |
|---|---|---|---|---|
| Language | Pure Python | Pure Python | Java | C++ |
| GitHub stars | — (canonical repo is on GitLab) | 405 | 237 | 758 |
| Licence | MIT | MIT | Apache-2.0 | Open source (academic-friendly) |
| Latest version | 4.1.2 (PyPI) | 26.0.8 (PyPI) | continuous releases on jaamsim.com | master tracks omnetpp-7.0.0pre2 |
| Install | pip install simpy | pip install salabim | ant build + downloadable executable | ./install.sh or official Docker image |
| Model style | Generator-based processes | Component classes and processes | Drag-and-drop GUI plus Java objects | NED topology plus C++ modules, ini config |
| Built-in statistics | No — bring your own | Yes — monitors for every quantity | Yes — input/output processing built in | Yes — result recording and analysis tooling |
| Animation | No | 2D and 3D via OpenGL | Interactive 3D graphics | GUI visualisation of the model |
| GUI | No | Animation only | Full modelling environment | Eclipse-based IDE |
| Learning curve | Low | Low to moderate | Low for modellers, Java for extension | High |
| Best for | Scripted experiments, CI, notebooks | Python models that need visibility | Non-programmer modellers, industrial studies | Networks, protocols, distributed systems |
A note on the star counts: they are a poor proxy for maturity here. SimPy has no meaningful GitHub home because development lives on GitLab (gitlab.com/team-simpy/simpy); the GitHub results are forks. JaamSim and OMNeT++ both have distributions far older than their GitHub presence.
Decision matrix: pick your use case
| Use case | Recommended | Why |
|---|---|---|
| Capacity planning script that runs in CI every night | SimPy | Pure Python, installs in seconds, deterministic with a seed, easy to assert on |
| Teaching a class how queues behave | Salabim | Monitors give you waiting-time histograms without extra code, plus animation for intuition |
| Warehouse, port, or mining study where a consultant delivers a model to a client | JaamSim | Drag-and-drop modelling, 3D output, and a documented citation for the report |
| Protocol or network simulation with thousands of nodes | OMNeT++ | Purpose-built for that domain, with a modular topology language and container deployment |
| Python model that needs 2D/3D visual output for stakeholders | Salabim | Animation is part of the framework, not an add-on |
| Model logic must be extended in plain code by an engineering team | JaamSim | New object palettes are written in standard Java, no domain-specific scripting language |
| Reproducible results published alongside a paper | Any of the four | All support fixed seeds; document the version and seed with the results |
SimPy — the Python default, and the one to start with
SimPy models a system as a set of processes that advance in simulated time, written as ordinary Python functions with yield points. There is no modelling language, no XML, and no compiled artefact — which is exactly why it fits notebooks, CI jobs, and code review.
| |
| |
Resources and queues use the same pattern: simpy.Resource(env, capacity=1) for a server, with resource.request() as req: yield req to claim it, and simpy.Store or simpy.Container for buffers and bulk quantities. Because the model is plain Python, the surrounding experiment — reading a CSV of arrival times, running 200 replications with different seeds, writing results to a dataframe — is ordinary Python too.
The trade-off is that SimPy deliberately ships no statistics collection and no animation. Every metric you report is something you instrument yourself: accumulate the waiting time in your process code, or use a monitoring helper. For people who like that (full control, no framework magic), SimPy is perfect. For people who want a waiting-time histogram without writing it, Salabim exists.
Salabim — SimPy’s ergonomics with monitors and OpenGL animation
Salabim is the project of Ruud van der Ham, documented at salabim.org with both online and PDF manuals, and it keeps the “process description” style while adding the pieces SimPy leaves out: monitors, queues, resources, and real animation.
| |
| |
The features that justify the extra abstraction surface:
- Monitors attach to any quantity — queue length, waiting time, resource utilisation — and produce the time-weighted statistics you actually want to report, instead of a bare mean you computed by hand.
- Animation is built in, in 2D and 3D, using OpenGL. The repository even ships an
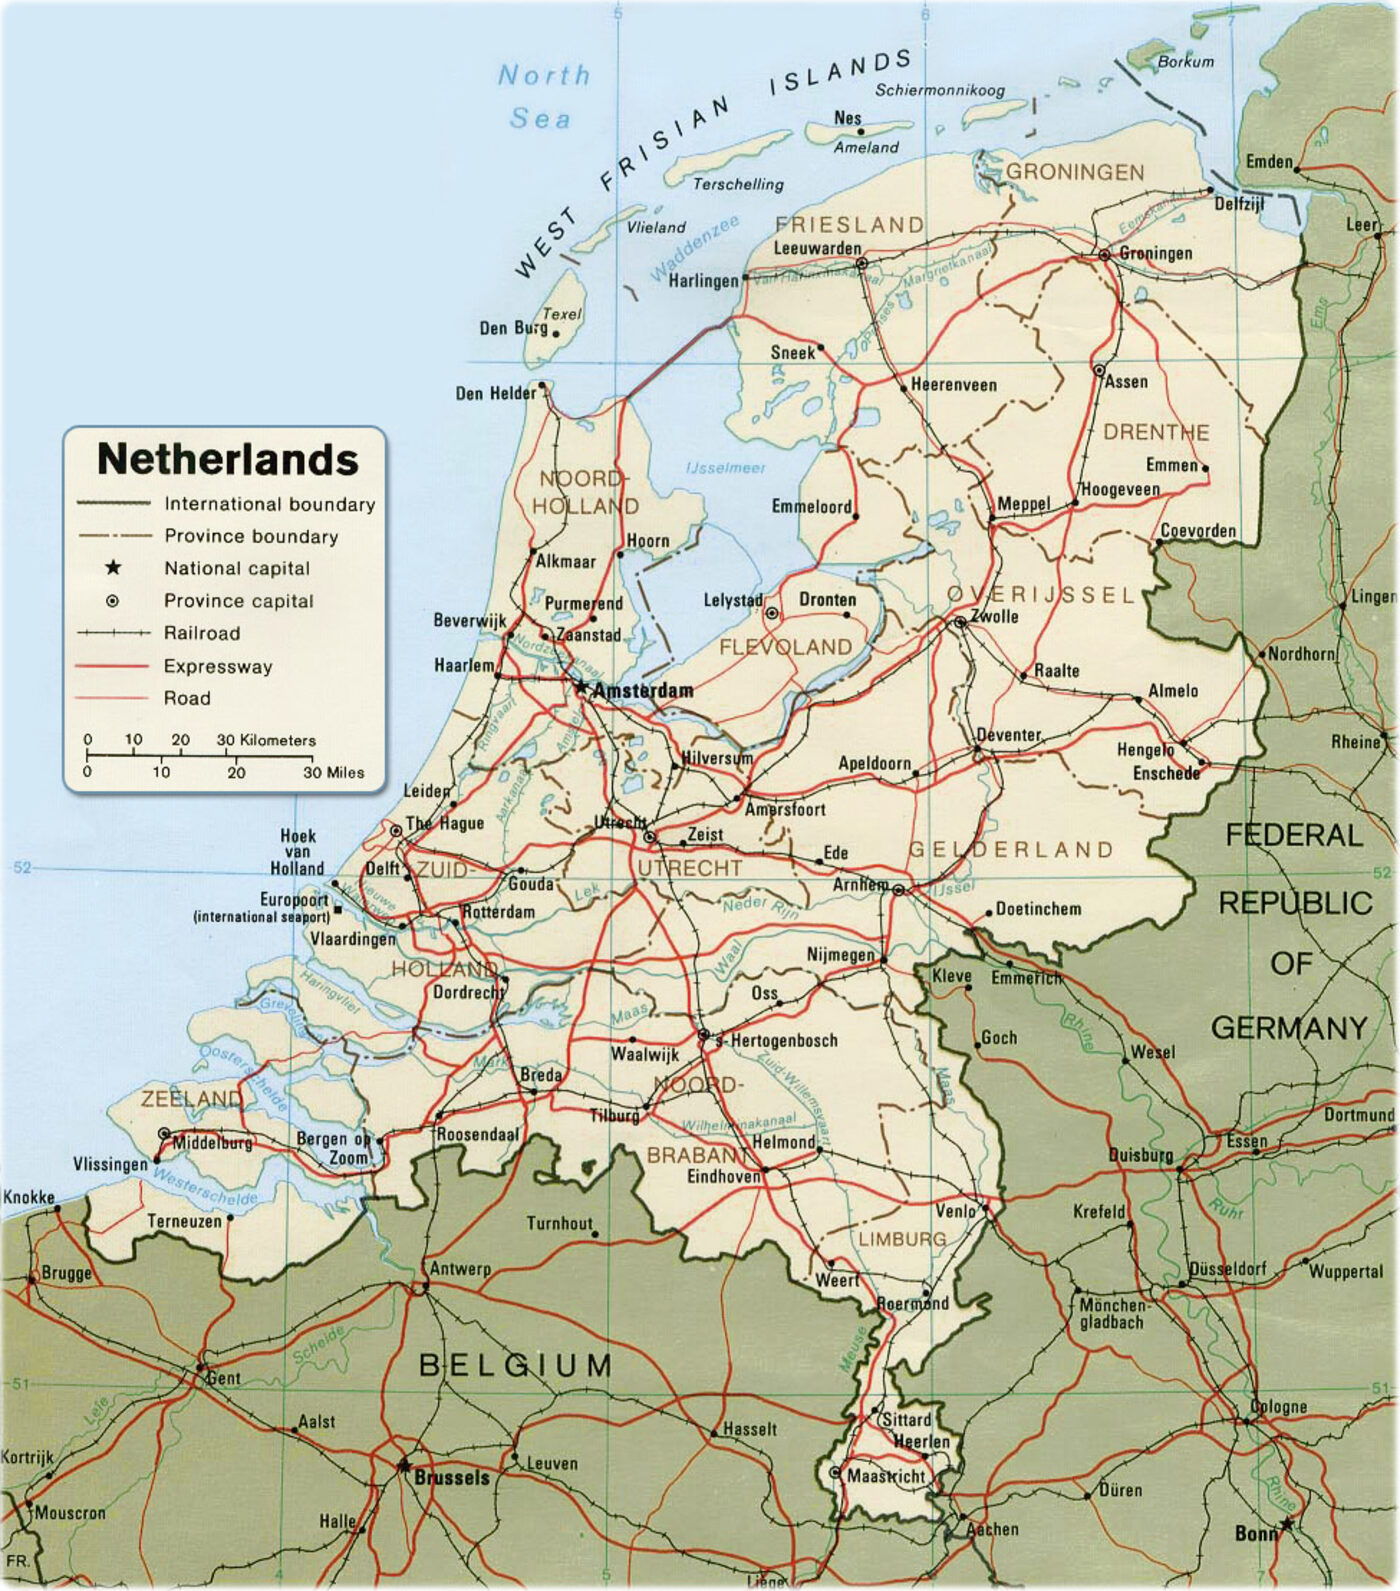
install_openglhelper for the animation dependencies, and its sample models directory contains complete animated studies, including a network-services animation whose map output is worth a look:
- Calendar-style versioning (26.0.8 at the time of writing) signals steady maintenance rather than a frozen academic artefact.
Salabim is the right answer when the model needs to be seen. Being able to show a stakeholder an animation of a queue collapsing at 14:00 does more for a project than any table of percentiles.
JaamSim — drag-and-drop modelling with interactive 3D
JaamSim is the outlier: it is a complete modelling environment written in Java and developed since 2002, and its primary interface is a drag-and-drop canvas with interactive 3D graphics, an input editor, and built-in input/output processing.
The installation path is different from the Python tools — you either download the executable from jaamsim.com or build the source yourself:
| |
Its design philosophy is stated plainly in the README and is the reason to choose it: unlike commercial simulation packages, JaamSim lets a team develop new palettes of high-level objects for a specific application. Those objects automatically get 3D graphics, appear in the drag-and-drop interface, and expose their inputs through the input editor. Crucially, all of that is written in standard Java — no specialised simulation language, no process-flow diagram notation, no proprietary scripting layer.
The built-in palettes cover most industrial studies out of the box: graphic objects (static 3D objects, overlay text, clocks, arrows, graphs), probability distributions (uniform, triangular, normal, erlang, gamma, weibull), basic objects (generator, sink, server, queue, delay, resource, branch, time series), calculation objects (weighted sum, polynomial, integrator, differentiator), and fluid objects (tank, pipe, pump). The fluid palette alone makes it a serious contender for mining, bulk terminal, and process-industry work, where a spreadsheet cannot express a tank filling up.
Because it is a maintainable, citable project (Apache-2.0, with a Zenodo DOI for academic use), JaamSim is what you reach for when a non-programmer has to own the model after you hand it over.
OMNeT++ — for networks, protocols, and serious scale
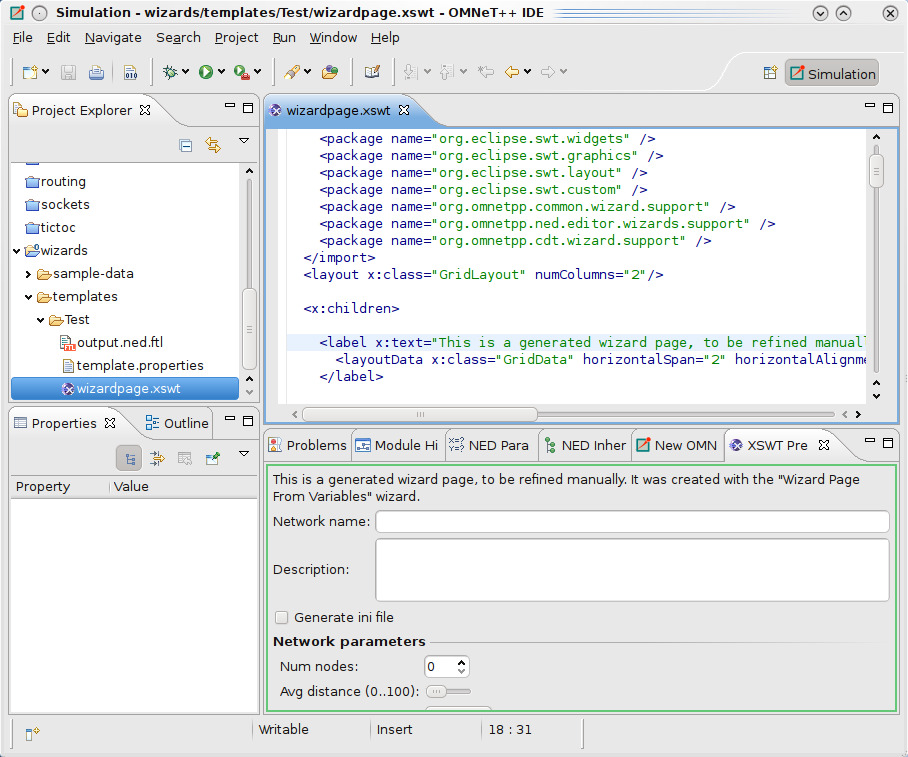
OMNeT++ is a mature, modular C++ simulation framework with its own ecosystem. Models are described in the NED topology language (components, gates, connections) and parameterised through ini files, and the framework ships an Eclipse-based IDE for editing, running, and visualising simulations.
Installation is the most involved of the four, but the project has made it deliberately straightforward:
| |
For Windows there is a mingwenv.cmd bootstrap that installs dependencies and then runs:
| |
If you would rather not build it at all, the project publishes an official Docker image (omnetpp/omnetpp) that supports Cmdenv execution — which is the deployment path worth knowing about, because it makes headless simulation runs in CI a solved problem rather than a dependency adventure.
The reason to pick OMNeT++ is domain fit. If you are simulating message-passing across a large network, its topology language expresses structure that would be tedious in Python, its result-recording tooling is designed for large batches of runs, and its module libraries reflect decades of protocol work. The cost is the steepest learning curve in this comparison and the need for C++ when you extend core components.
Pitfalls that ruin simulation studies
Run many replications, not one long one. A ten-million-event run gives you one extremely precise sample of one random draw, not a distribution. Run 100–1000 independent replications with different seeds and report the mean with a confidence interval, which is standard practice in the field and the difference between a defensible study and a number someone can dismiss.
Warm up, then measure. Every queueing system starts empty, which is not the steady state you care about. Discard a warm-up period before recording statistics — SimPy forces you to do this explicitly, and the tools with built-in monitors make it easy to forget.
Validate against reality before optimising. Compare a baseline model against observed data from the real system, and be honest about where the fit is poor. An invalidated model that recommends a €2M investment is worse than no model.
Use common random numbers when comparing designs. If you compare design A and design B with different seeds, you are measuring the difference between seeds as much as the difference between designs. Reuse the same seed set across alternatives.
Watch your event log size. Debug tracing and full event logging can generate gigabytes on long runs. Cap trace output, and log aggregated statistics rather than every event in production runs.
Pin the version with the results. These frameworks evolve, and a model is a piece of code. Record the framework version, the seed set, and the model revision alongside every published result.
For related reading, our guide to self-hosted capacity planning and forecasting tools covers the infrastructure side of the same question, the agent-based modelling comparison covers simulation where agents differ instead of events, and the constraint programming solver comparison is the right next step when you need the optimal configuration rather than the simulated behaviour of one.
FAQ
What is discrete-event simulation, in one paragraph? You describe a system as entities flowing between resources (customers, trucks, packets, patients), each step taking a sampled amount of time drawn from a probability distribution. The simulator jumps from event to event, accumulating statistics about queues, waiting times, and utilisation. It is the standard tool for capacity questions because it produces distributions and percentiles, not a single average.
Should I use SimPy or Salabim? Start with SimPy if you want the smallest possible dependency and you are comfortable instrumenting your own statistics. Choose Salabim when you want built-in monitors for waiting times and utilisation, and especially when you want 2D or 3D animation. Both are pure Python and both use the process/generator modelling style, so migrating later is cheap.
Is JaamSim viable without writing Java? Yes. The drag-and-drop interface, input editor, and built-in palettes are usable by modellers who do not program. Java only enters the picture when you need a new type of high-level object for your domain — and even then the README is explicit that this uses standard Java tooling rather than a proprietary simulation language.
Do I need OMNeT++ for a network simulation? Only if the network is the system you are studying. For queueing questions inside an application (a service handling requests), SimPy or Salabim are faster to work with. OMNeT++ pays off when you need NED topology modelling, protocol-level fidelity, and batch runs across many parameter combinations.
Can these frameworks run in containers and CI? Yes, and it is worth setting up early. The Python two install from PyPI inside any image; JaamSim ships a self-contained executable with its dependencies; OMNeT++ publishes an official Docker image for headless Cmdenv runs. Automating a nightly batch of replications turns a one-off study into a monitoring tool.
How many replications is enough? Enough that the confidence interval on your key metric is narrower than the decision threshold. In practice that means starting at 30 iterations for a rough read, then going to several hundred for the headline number. Halving the interval costs roughly four times the runs, which is why people automate it and walk away.
💰 想测试你的市场判断力?我用 Polymarket 做预测市场交易——这是全球最大的预测市场平台,从大选结果到技术监管时间线,什么都可以押注。和赌博不同,这是真正的信息市场:你懂的信息越多,胜率越高。我靠预测技术相关事件的走向已经赚了不少。用我的邀请链接注册:Polymarket.com